ThesisHub Research Resources
Using Charts, Graphs, Figures and Tables in Research
Visual elements can make complex findings easier to understand. Effective charts, figures, and tables should clarify the research rather than simply decorate the document.
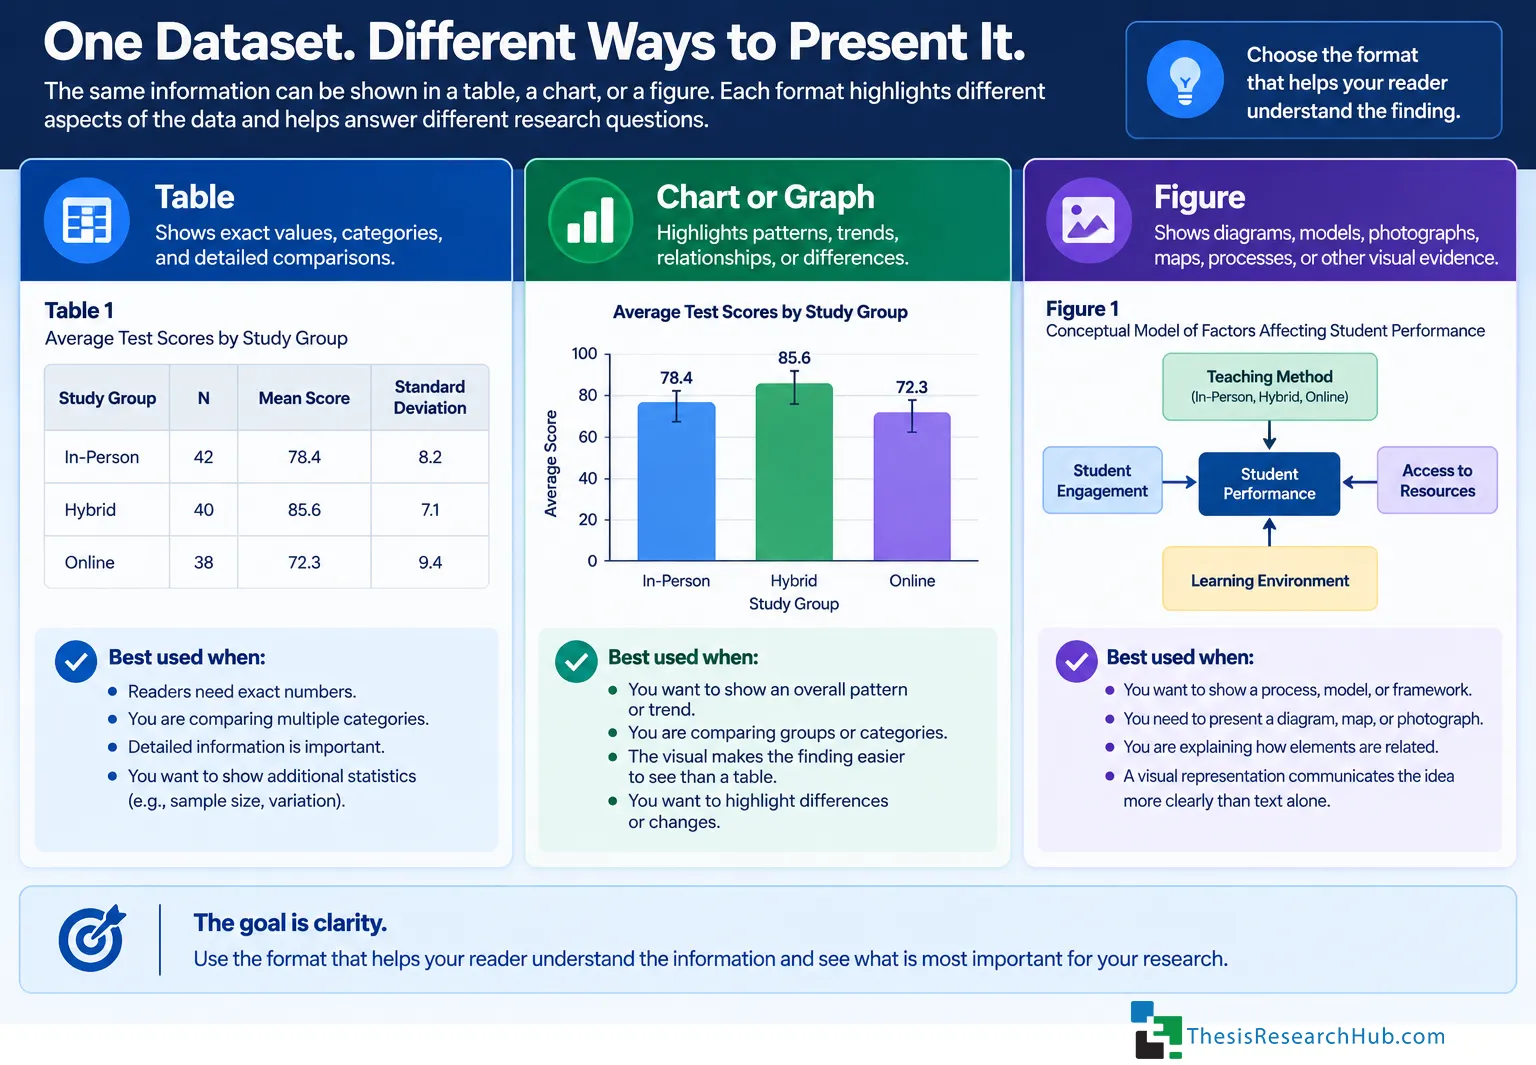
Let the information determine the format
A visual should make information easier to understand than the same information presented only in prose .
Tables
Best when readers need exact values, categories, or detailed comparisons.
Charts & Graphs
Useful for showing trends, changes, distributions, relationships, or differences.
Figures
Useful for diagrams, models, photographs, maps, processes, and other visual evidence.
Every visual should answer a question
Before inserting a chart or table, ask what the reader is supposed to learn from it.
Ask yourself
- • What finding does this visual communicate?
- • Why is that finding important to the research question?
- • Could the information be understood more clearly another way?
- • Does the reader know what to notice?
The text and the visual should work together
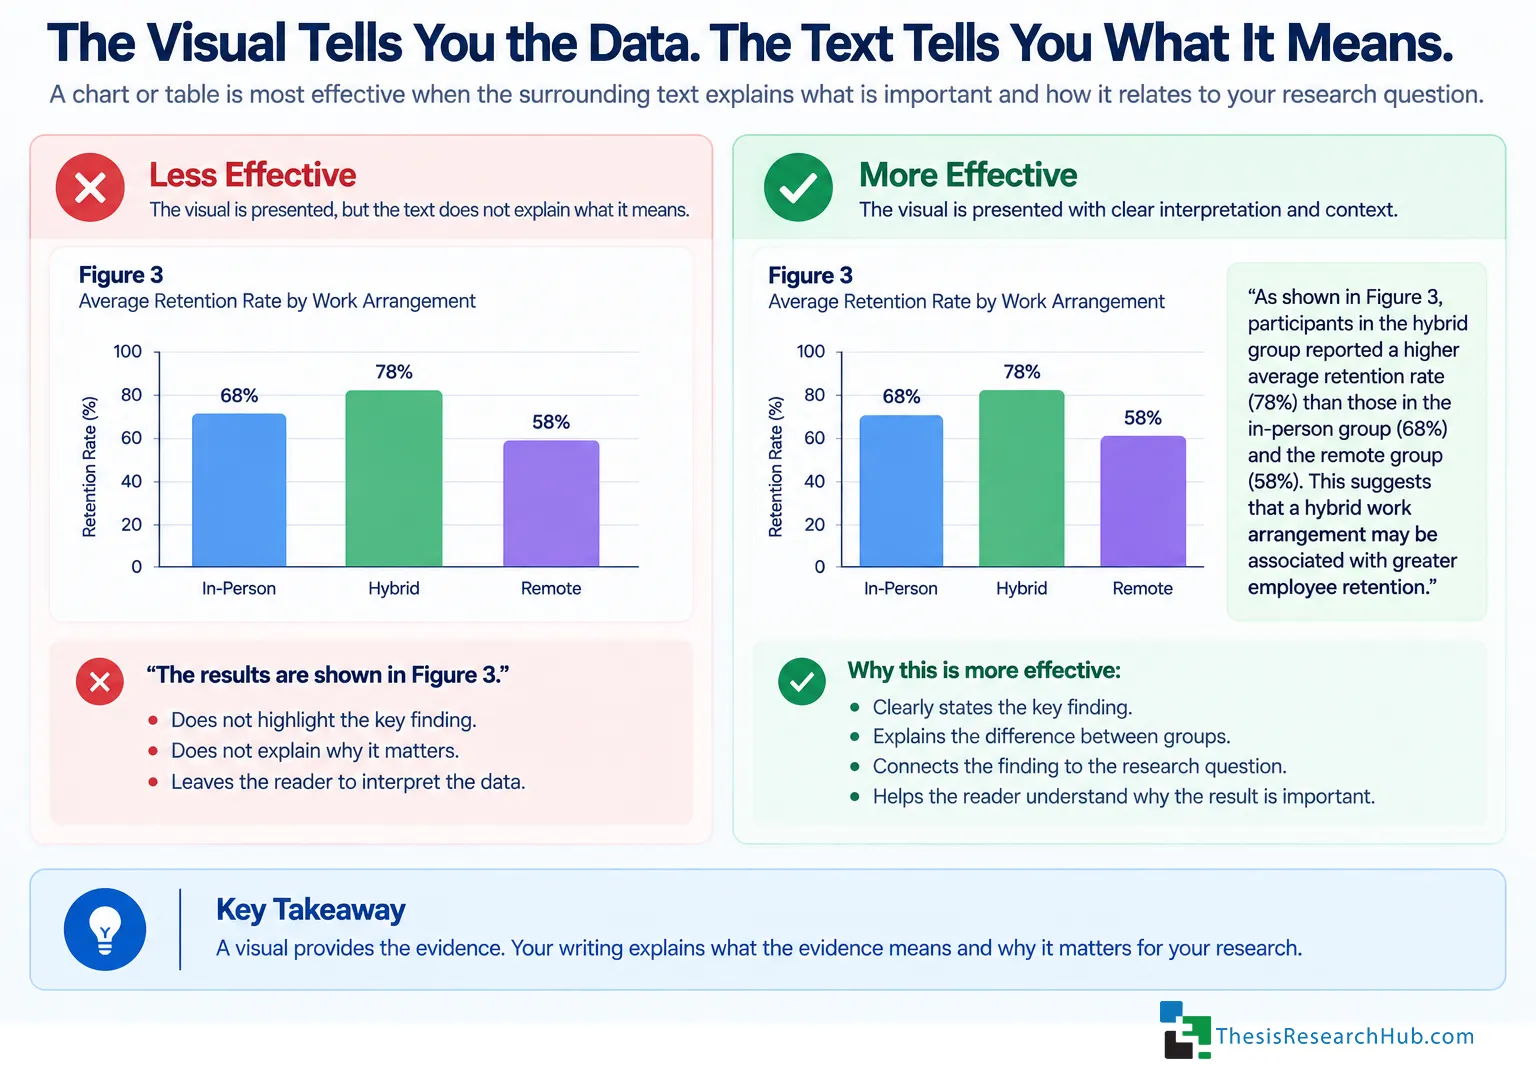
A figure or table should not simply appear without explanation.
Less effective
“The results are shown in Table 3.”
More useful
“As shown in Table 3, participants in the hybrid group reported a higher average retention rate than participants working entirely remotely.”
The second example tells the reader what matters about the visual .
Make captions and labels do useful work
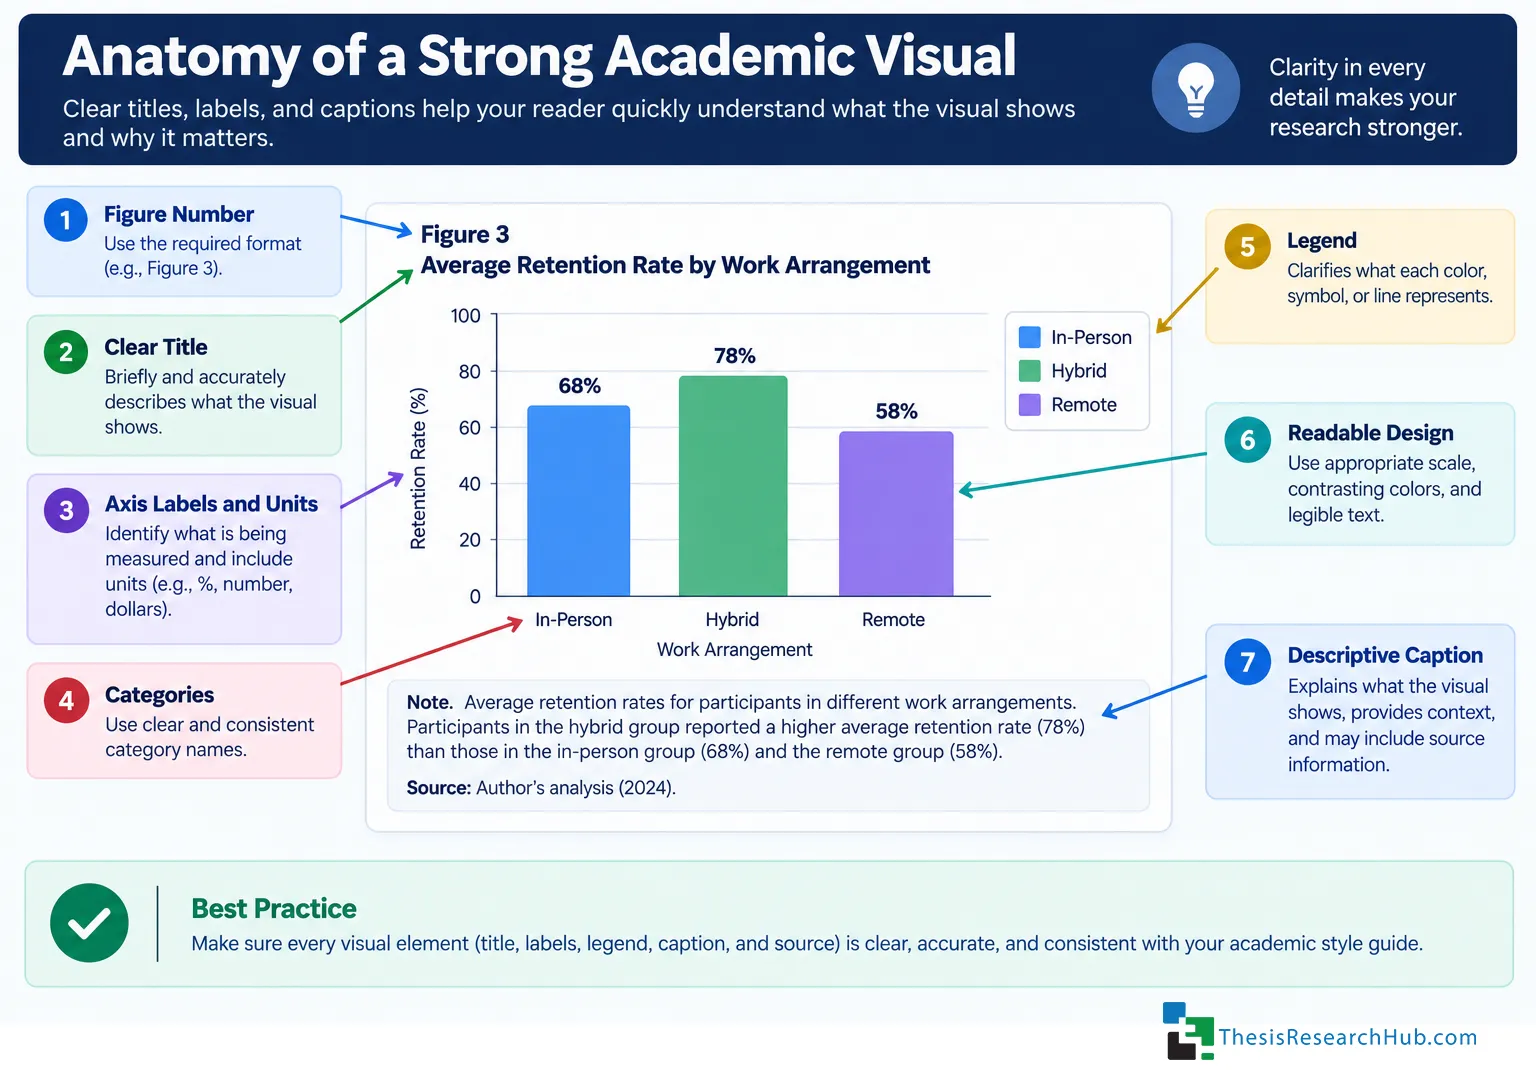
Readers should be able to understand what a visual represents without guessing.
Check titles, captions, legends, units, axes, categories, and source information.
The exact requirements vary by academic style and institution, but clarity should remain the goal.
Formatting rules matter
Universities and style manuals may establish specific requirements for numbering, placement, captions, source notes, lists of figures, and lists of tables.
Always verify the requirements that apply to your own research project.
Continue Your Research
Related Research Library Articles
Explore related articles for additional guidance, explanations, and research strategies.
Data, Figures & Tables
How to Present Research Data With Tables, Figures, and Charts
Learn how to present research data clearly using tables, figures, and charts, including when to use each format, how to communicate findings effectively, and how to manage captions, citations, and references.
Read Article →
Data, Figures & Tables
How to Decide Whether Evidence Belongs in a Table, Figure, or Prose
Not every piece of research evidence should be presented the same way. Learn when evidence is clearer as prose, a table, or a figure—and how to choose the format that best communicates what your reader needs to understand.
Read Article →
How ThesisHub Helps
Support the research process without losing sight of your project
ThesisHub helps researchers organize figures and tables alongside their writing so that visual evidence, captions, references, and final document preparation can remain connected to the research project.
Explore More Research Topics
Research Brainstorming
Develop ideas and turn broad interests into research directions.
Thesis Writing
Develop academic writing progressively throughout a research project.
Literature Review
Organize and synthesize scholarship around a research problem.
Thesis Review
Review structure, clarity, consistency, and completeness.
Thesis Formatting
Prepare a research document for institutional and publication requirements.